The Performance Summary dashboard is designed to provide you with a high-level overview of your hotels’ performance through the Hotel Trader Exchange.
Here's a breakdown of the key components you'll find on this dashboard:
This dashboard supports dynamic analysis of data through the following date ranges:
- Choose between Arrival Date or Booking Date
- Select a time range from the list of available options
- Compare your current performance with the past performance, or visualise predictions based on historic data by choosing Future Dates.

By default, the Performance Dashboard displays data for the next 90 days based on Arrival Date.
Dashboard KPI Indicators
The Performance Summary dashboard provides you with a overview of your performance in terms of Booking and Revenue over time on the Hotel Trader Exchange.
Each KPI provides a comparison of your current performance with the previous year or projected future dates.

| KPI | Description |
|---|---|
| Revenue | Represents the total room revenue generated from the guest room sales. |
| Room Nights | The number of nights sold in a specific time period. It is calculated by multiplying one room times one night. |
| Average Daily Rate (ADR) | The average daily rate (ADR) indicates the average revenue earned for an occupied room on a given day. It is calculated by dividing the room nights from the Revenue amount. |
| Lead Time | Average Lead Time is the time between making a reservation and actually arriving at the property. |
| Length of Stay | Length of stay is the average number of nights per booking. |
| Cancellation Rate | Percent of bookings canceled. |
| Travel Buyers | Count of Travel Buyers who are selling your rooms for the chosen duration. |
Hotel Performance Summary
See how your property is performing and identify areas for action.
Revenue Performance by Week of Booking
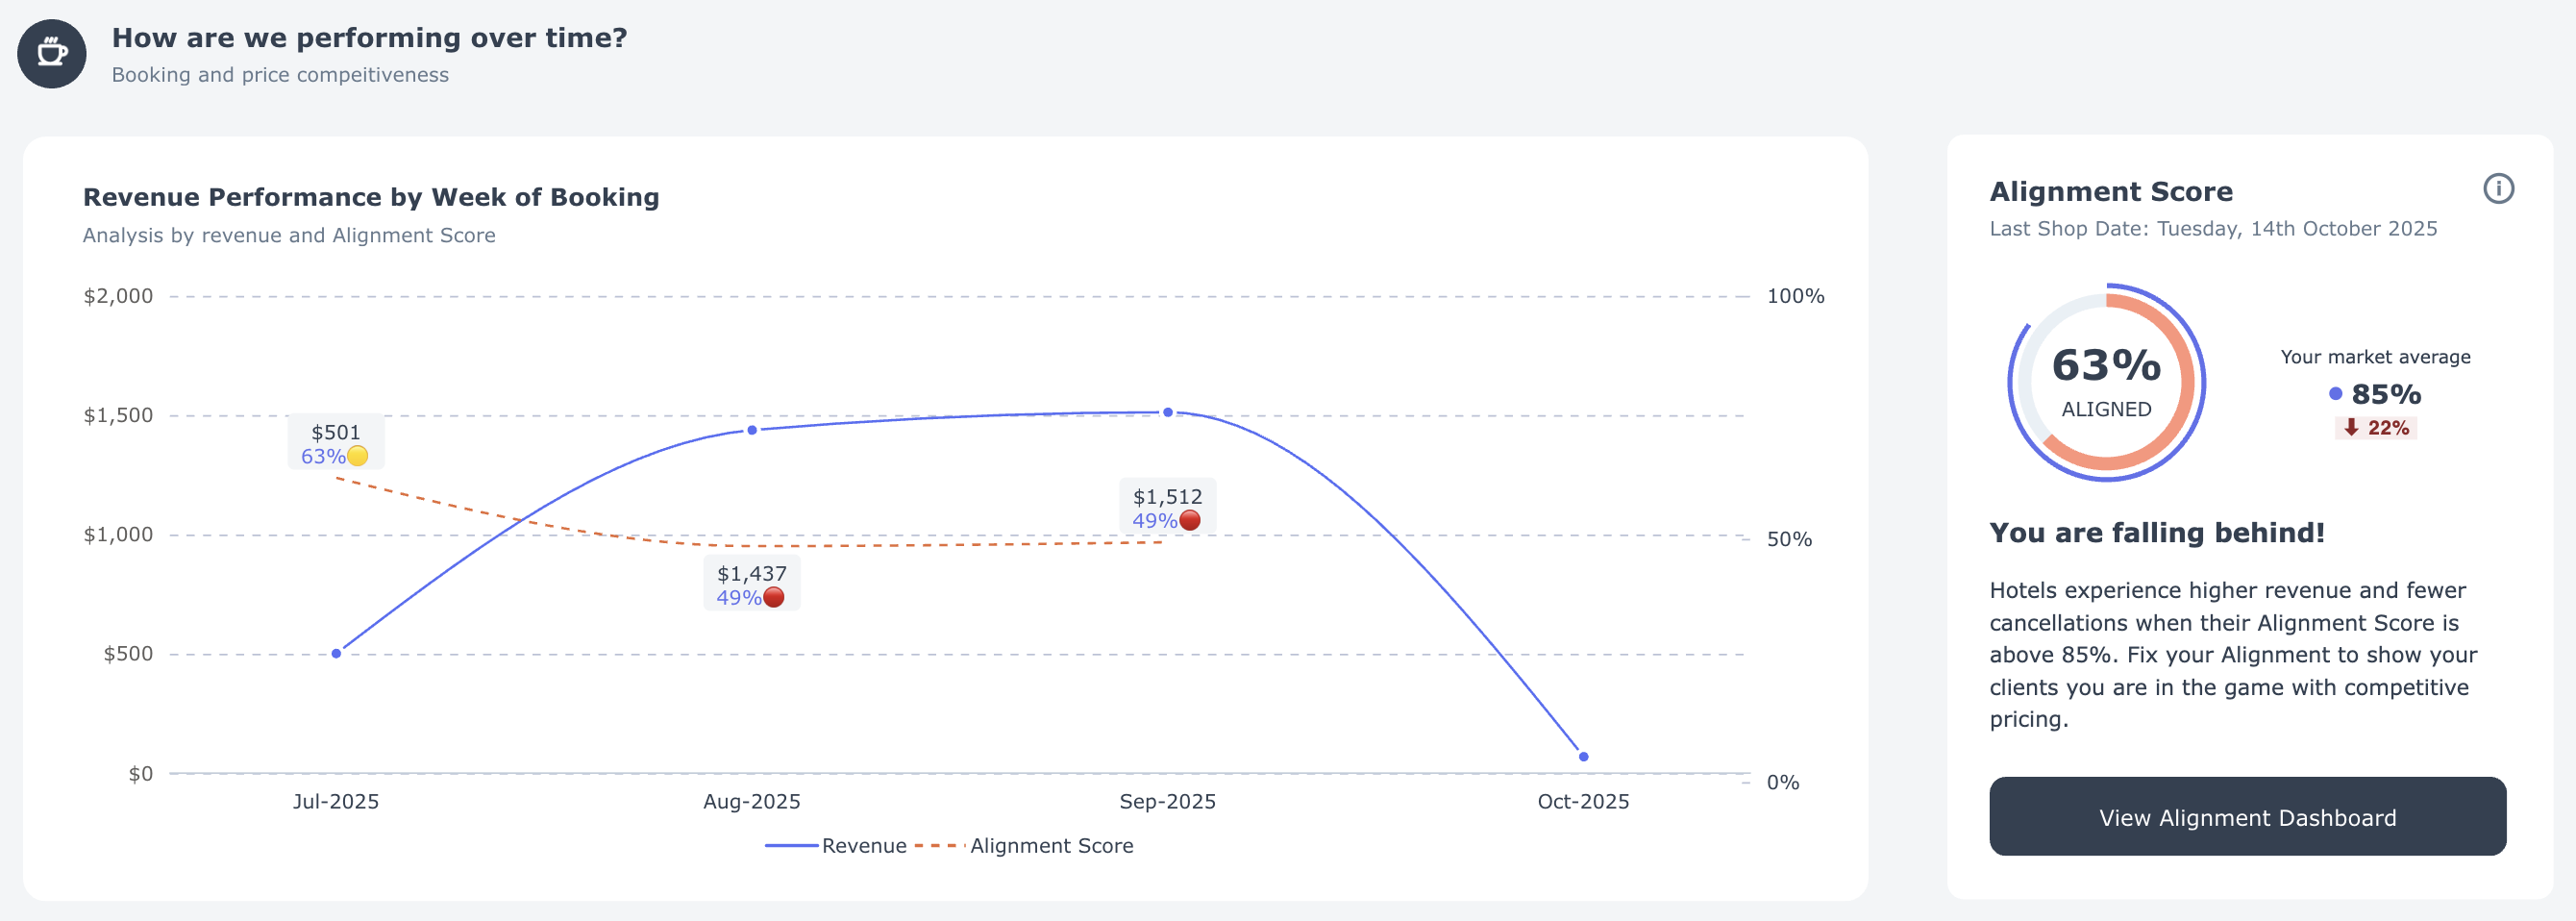

- What you see: Your weekly booking revenue (blue line) and your Alignment Score (orange dotted line) — a measurement of how competitive your prices are in the market.
- Why it matters: Properties with an Alignment Score above 85% generate more revenue and experience fewer cancellations.
- What to do: When your score drops, review your rates in the Alignment Dashboard to maintain competitiveness and protect revenue.
Booking Pace by Month of Check-In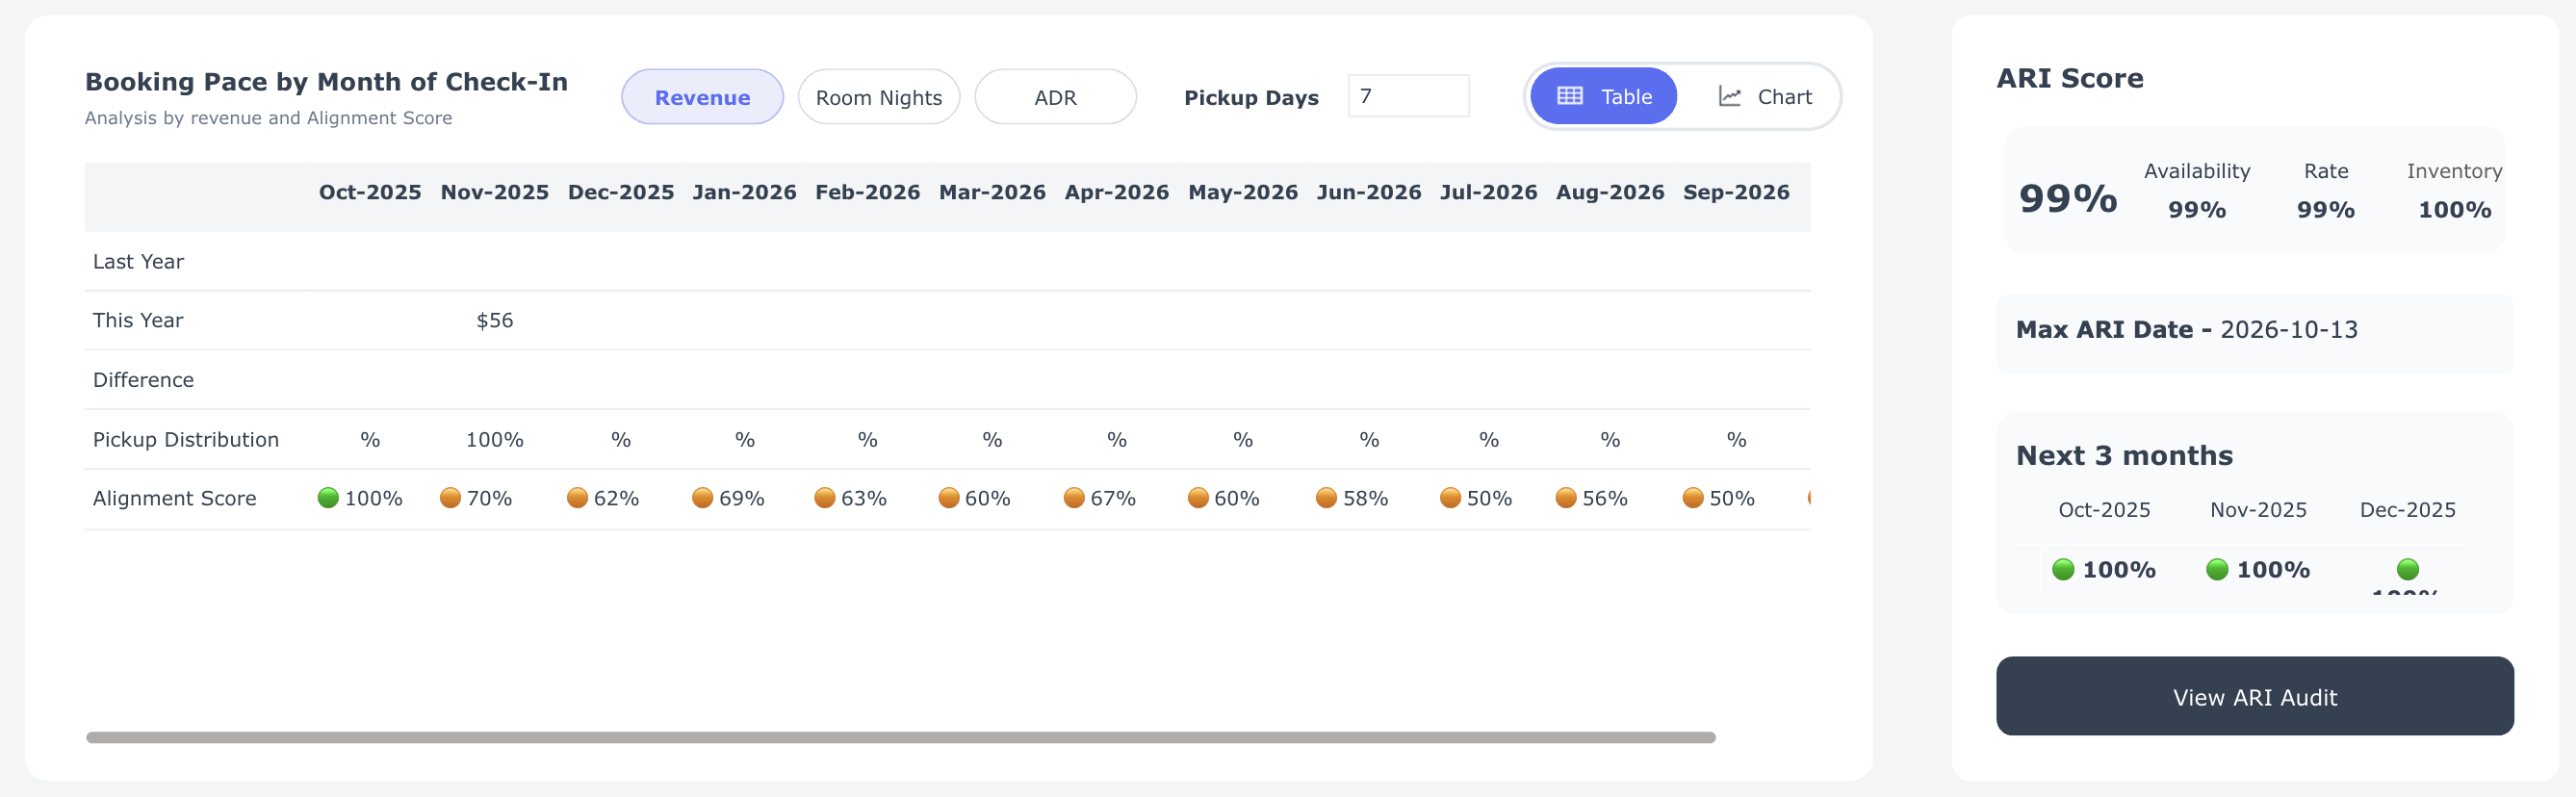

- What you see: Booking momentum for this year month by month compared to last year.
- Your controls:
- Metrics – Switch between:
- Revenue – Total booking revenue.
- Room Nights – Total nights booked.
- ADR (Average Daily Rate) – Average price per night.
- Pickup Days – Lead time before check-in.
- View Options – Toggle between Chart for trends and Table for detailed numbers.
- Metrics – Switch between:
- What to do: Use the chart to identify performance gaps early, compare with last year's results, and take appropriate action — adjust rates, create promotions, or focus marketing efforts to stimulate demand.
How to Interpret
- Revenue: If this year's line falls below last year's for upcoming months, you risk underperforming — consider implementing promotions or adjusting rates.
- Room Nights: When bookings lag behind last year, occupancy may decrease; examine your availability and demand drivers.
- ADR: A lower ADR than last year suggests excessive discounting; if ADR is higher but bookings are slow, your prices might be too high.
- Pickup Days: Shorter lead times indicate last-minute bookings; longer lead times suggest strong future demand or early discount strategies.
ARI Scorecard
A snapshot of your availability, rate, and inventory available on the Hotel Trader Exchange to sell.
We recommend keeping at least 365 days of inventory on shelf at all times.
Distribution Summary
Understand which clients, rate plans, and room types drive your revenue — and explore these trends more deeply with interactive filtering.

What you see:
This section shows your top 10 performers across three key dimensions:
- By Client Name – Which clients generate the most revenue.
- By Rate Code – Which rate plans produce the highest revenue.
- By Room Type – Which room categories are booked most frequently.
Interactive filtering (hidden power feature):
- Click on any Client Name, Rate Code, or Room Type to instantly update the other two charts.
- The refreshed charts will display the top 10 performers for your selection only.
- Example: Click on a client name to see that client's top 10 rate plans and room types.
- Click on a rate code to discover which clients and room types use that plan most.
- Click on a room type to identify which clients and rate codes book it most frequently.
Why it matters:
- Quickly identify which combinations of clients, rate plans, and room types generate the most revenue.
- Spot upsell opportunities (e.g., when a client consistently books lower-category rooms).
- Identify where to focus promotions or adjust pricing to maximize yield.
What to do:
- Use the interactive filtering to focus on specific clients, rate plans, or room types.
- Identify patterns and mismatches (e.g., a popular rate plan that's underutilized by a key client).
- Adjust your rate strategy or marketing campaigns to capture more revenue from your most profitable combinations.
See how competitive your direct rates are and take action to improve them.
The Alignment Score Dashboard gives you a focused view of your hotel’s price competitiveness over time. It helps you understand how often travel buyers find your direct rates aligned with or better than third-party rates in the B2B marketplace.
Hotel Trader’s unique Alignment Score measures a travel buyer’s ability to buy directly from you.
The Alignment Score Dashboard is a key part of Hotel Trader's commitment to transforming the travel industry through transparency, self-serve controls, and data-driven insights.
Here's a breakdown of the key components you'll find on the dashboard:
- Alignment Score over Time
- Alignment score by Rate Shop Date
- Alignment Score by Length of Stay
- Alignment Score by Lead Days
Alignment Score over Time
See how your Alignment Score has changed over time and understand the impact of pricing differences across channels.

What you see:
- Alignment Score by Month of Check-In – Shows how closely your rates align with third-party channels for upcoming months.
- Green bars (70%–100%): You’re in good shape — buyers are likely to choose your direct rate.
- Yellow bars (60%–70%): Some room for improvement.
- Red bars (0%–60%): Your direct rate is often higher than what buyers find elsewhere.
- Rate Gap % by Month of Check-In – Displays the percentage difference between your lowest available rate and other B2B channel rates. A smaller gap means stronger competitiveness.
How to interpret:
- High Alignment + Low Rate Gap = Your direct pricing is competitive — keep it up.
- Low Alignment + High Rate Gap = You may be losing bookings to cheaper third-party offers.
Tip:
Hotels with Alignment Scores above 85% typically see over 120% revenue growth from improved visibility and buyer preference.
Use our data-driven tailored Smart Promo recommendations to boost your direct bookings.
Alignment Score by Rate Shop Date
Track how your price competitiveness changes each day based on rate shop activity.

What you see:
- A daily trend line of your Alignment Score over the last 45 days.
- Below the chart, a comparison table showing Alignment % and Rate Gap % for each date.
How to interpret:
- Look for steady improvement in your Alignment Score — it shows consistent competitiveness.
- Large daily drops can indicate sudden undercutting by third parties or outdated rate updates.
Alignment Score by Length of Stay
Understand how pricing competitiveness changes for stays of different lengths.

What you see:
- Bars showing Alignment % for stays from 1 to 5 nights.
How to interpret:
- Short stays (1–2 nights) often represent high-demand bookings — maintaining strong alignment here maximizes quick conversions.
- Longer stays (3–5 nights) with low alignment could signal rate parity gaps or outdated long-stay discounts.
Action: Adjust long-stay pricing or apply targeted promos to close gaps and improve alignment.
Alignment Score by Lead Days
See how your competitiveness changes depending on how far in advance bookings are made.
 |
 |
Hover over the bars to see a breakdown of Alignment % by length of stay brackets.
What you see:
- Alignment % grouped by lead time ranges — 0–7, 8–30, 31–90, 91–180, and 181–360 days.
How to interpret:
- 0–30 days: Low scores here indicate you’re losing last-minute bookings — consider short-term promos.
- 31+ days: If alignment drops for future months, your advanced rates may be too high or not refreshed frequently enough.
Action: Use this insight to fine-tune advance booking rates and stay aligned across all lead-time segments.
See which travel buyers are driving your business and how your rate plans are performing across them.
The Travel Buyer Status Dashboard helps you understand the performance, health, and connectivity of your travel buyer network.
It highlights which buyers are most active, which rate plans are performing best, and where corridors may be closed or underperforming — so you can act quickly to strengthen your B2B relationships.
Here's a breakdown of the key components you'll find on this dashboard:
Dashboard KPI Indicators
Get a snapshot of how your travel buyer network is performing and where to focus next.

What you see:
- Enabled Rate Plans – Total number of active rate plans currently connected to travel buyers.
- Top Performing Travel Buyer – The travel buyer generating the highest revenue for your property.
- Top Performing Rate Plan – The best-selling rate plan across all travel buyers.
- Closed Corridors – The number of buyer connections that are restricted or unavailable for bookings.
Why it matters:
This quick overview helps you identify high-value partnerships and spot any connectivity gaps that may be limiting your distribution reach.
Market Analysis
Analyze your travel buyers’ search and booking activity over time to identify who’s driving demand — and who might need attention.

What you see:
Each row in the table represents a travel buyer, showing key metrics such as:
- Buyer Category – Maturity level of the buyer (Mature, Established, etc.).
- BRGs (Best Rate Guarantees) – Parity risk occurrences over 12 months and 90 days.
- Buyer Enabled / Buyer Searched – Whether the buyer is connected and actively searching your property.
- Buyer Share % – Your share of the buyer’s total room nights or hotel listings in your city.
- ADR and ALOS – Comparison of the buyer’s average daily rate and length of stay versus your property’s.
Your controls:
- Date Filters – View data by Arrival Date or Booking Date across preset ranges (Today, 7 Days, 30 Days, 90 Days, Year-to-Date).
- Buyer Risk Sort – Filter clients by risk category (No Risk, Low Risk, or Risk) based on pricing parity performance.
- Search Filter – Choose between All Travel Buyers, Buyers Searching, or Zero Searches to focus your analysis.
- Status Toggles – Include or exclude Open, Partial, or Closed buyers in your view.
How to interpret:
- High Buyer Share % and Active Searches indicate strong engagement — nurture these buyers.
- Low Buyer Share % or Zero Searches suggest untapped potential — review rate competitiveness or open corridors.
- Repeated BRG alerts mark rate parity issues — check your rates and correct misalignments.
What to do:
Focus your attention on travel buyers with high engagement but moderate rate risk to strengthen partnerships and boost conversion.
Rate Plan Availability Matrix
Understand which rate plans are available to each travel buyer and identify where connections may be missing.

Your controls:
- Travel Buyer Filter – Select a specific travel buyer or view all.
- Rate Plan / Code Filter – Filter by individual rate plan or review all rate plans.
- Status Toggles – Show Open and Closed buyers.
What you see:
- Each cell shows whether a rate plan is available (green) or unavailable (red) to a travel buyer.
- This provides a quick visual confirmation that your rate plans are correctly distributed across your buyer network.
How to interpret:
- Green dots – The rate plan is open and bookable for that buyer.
- Red dots– The rate plan is not available or corridor is closed.
What to do:
If key buyers don’t have access to your best-performing rate plans, contact your Hotel Trader Account Manager.
Key Takeaways
- Use this dashboard to keep your distribution network healthy and competitive.
- Regularly check for closed corridors or inactive buyers to avoid missed bookings.
- Use the Market Analysis section to find which buyers drive the most value — and where small changes in alignment could lead to big gains.
Ensure your rooms and rates are always visible to buyers.
The ARI Audit Dashboard (Availability, Rates, and Inventory) helps you track whether your property's data is complete and available for booking across all future dates. Keeping ARI coverage at 100% ensures your property remains visible and competitive on the Hotel Trader marketplace.
Why It Matters
- Complete ARI coverage ensures maximum visibility across all demand partners.
- Gaps in ARI can lead to missed bookings and lower buyer confidence.
- Maintaining 365 days of forward-loaded ARI data improves your property's search ranking and conversion rate.
Tip:
Check your ARI Audit Dashboard weekly to catch and fix issues before they impact your visibility.
Here's a breakdown of the key components:
Dashboard KPIs
Monitor your ARI health and identify future dates where rates, availability, or inventory might be missing.

What you see:
- ARI by Rate Shop Date — Displays your ARI performance month by month, including:
- ARI — Combined measure of Availability, Rates, and Inventory.
- Availability — Shows if rooms are open for sale.
- Rates — Confirms that rate plans are published and bookable.
- Inventory — Indicates if stock is assigned to rate plans.
- ARI Score — A summary metric showing your property's total ARI readiness, broken down by:
- Availability (blue)
- Rates (orange)
- Inventory (yellow)
How to interpret:
- A perfect score (100%) means your property is fully visible for all future dates.
- Any drop in percentage signals missing ARI data that could prevent buyers from booking.
What to do:
- If your ARI Score is below 100%, review your PMS or channel manager to ensure all rate plans are loaded for the next 365 days.
- Focus first on months with incomplete data and correct the gaps in availability or pricing.
ARI Detail — By Rate Plan and Room Type
See which rate plans and room types have complete ARI coverage and identify gaps by month.

Your controls:
- View Options: Toggle between:
- Room Type + Rate Plan
- Rate Plan + Room Type
- Room Type
- Rate Plan
- These options let you analyze ARI coverage based on your property structure or rate distribution strategy.
What you see:
- A color-coded grid showing Availability, Rates, and Inventory percentages by month.
- Green cells (100%) indicate full coverage. Lighter or incomplete cells highlight missing ARI data.
How to interpret:
- Consistent 100% across all months means your ARI is well-maintained and fully bookable.
- Gaps in green cells suggest missing rates or closed inventory for that rate plan or room type.
What to do:
- Review the specific rate plan or room type where ARI coverage drops below 100%.
- Update your system to load future availability and rates so buyers can always find your property.
The Supplier Portal by default, loads the first property in your portfolio. If you are managing multiple properties and would like to see the KPIs for another property, follow the steps below:
- Click on the Property Selector on the top right-hand corner
- Select another property from the available options
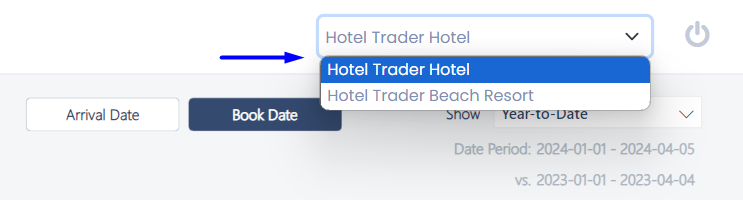
- The dashboard refreshes with relevant numbers
