The Performance Summary dashboard is designed to provide you with a high-level overview of your hotels’ performance through the Hotel Trader Exchange.
Here's a breakdown of the key components you'll find on this dashboard:
This dashboard supports dynamic analysis of data through the following date ranges:
- Choose between Arrival Date or Booking Date
- Select a time range from the list of available options
- Compare your current performance with the past performance, or visualise predictions based on historic data by choosing Future Dates.

By default, the Performance Dashboard displays data for the next 90 days based on Arrival Date.
Dashboard KPI Indicators
The Performance Summary dashboard provides you with a overview of your performance in terms of Booking and Revenue over time on the Hotel Trader Exchange.
Each KPI provides a comparison of your current performance with the previous year or projected future dates.

| KPI | Description |
|---|---|
| Revenue | Represents the total room revenue generated from the guest room sales. |
| Room Nights | The number of nights sold in a specific time period. It is calculated by multiplying one room times one night. |
| Average Daily Rate (ADR) | The average daily rate (ADR) indicates the average revenue earned for an occupied room on a given day. It is calculated by dividing the room nights from the Revenue amount. |
| Lead Time | Average Lead Time is the time between making a reservation and actually arriving at the property. |
| Length of Stay | Length of stay is the average number of nights per booking. |
| Cancellation Rate | Percent of bookings canceled. |
| Travel Buyers | Count of Travel Buyers who are selling your rooms for the chosen duration. |
Hotel Performance Summary
See how your property is performing and identify areas for action.
Revenue Performance by Week of Booking
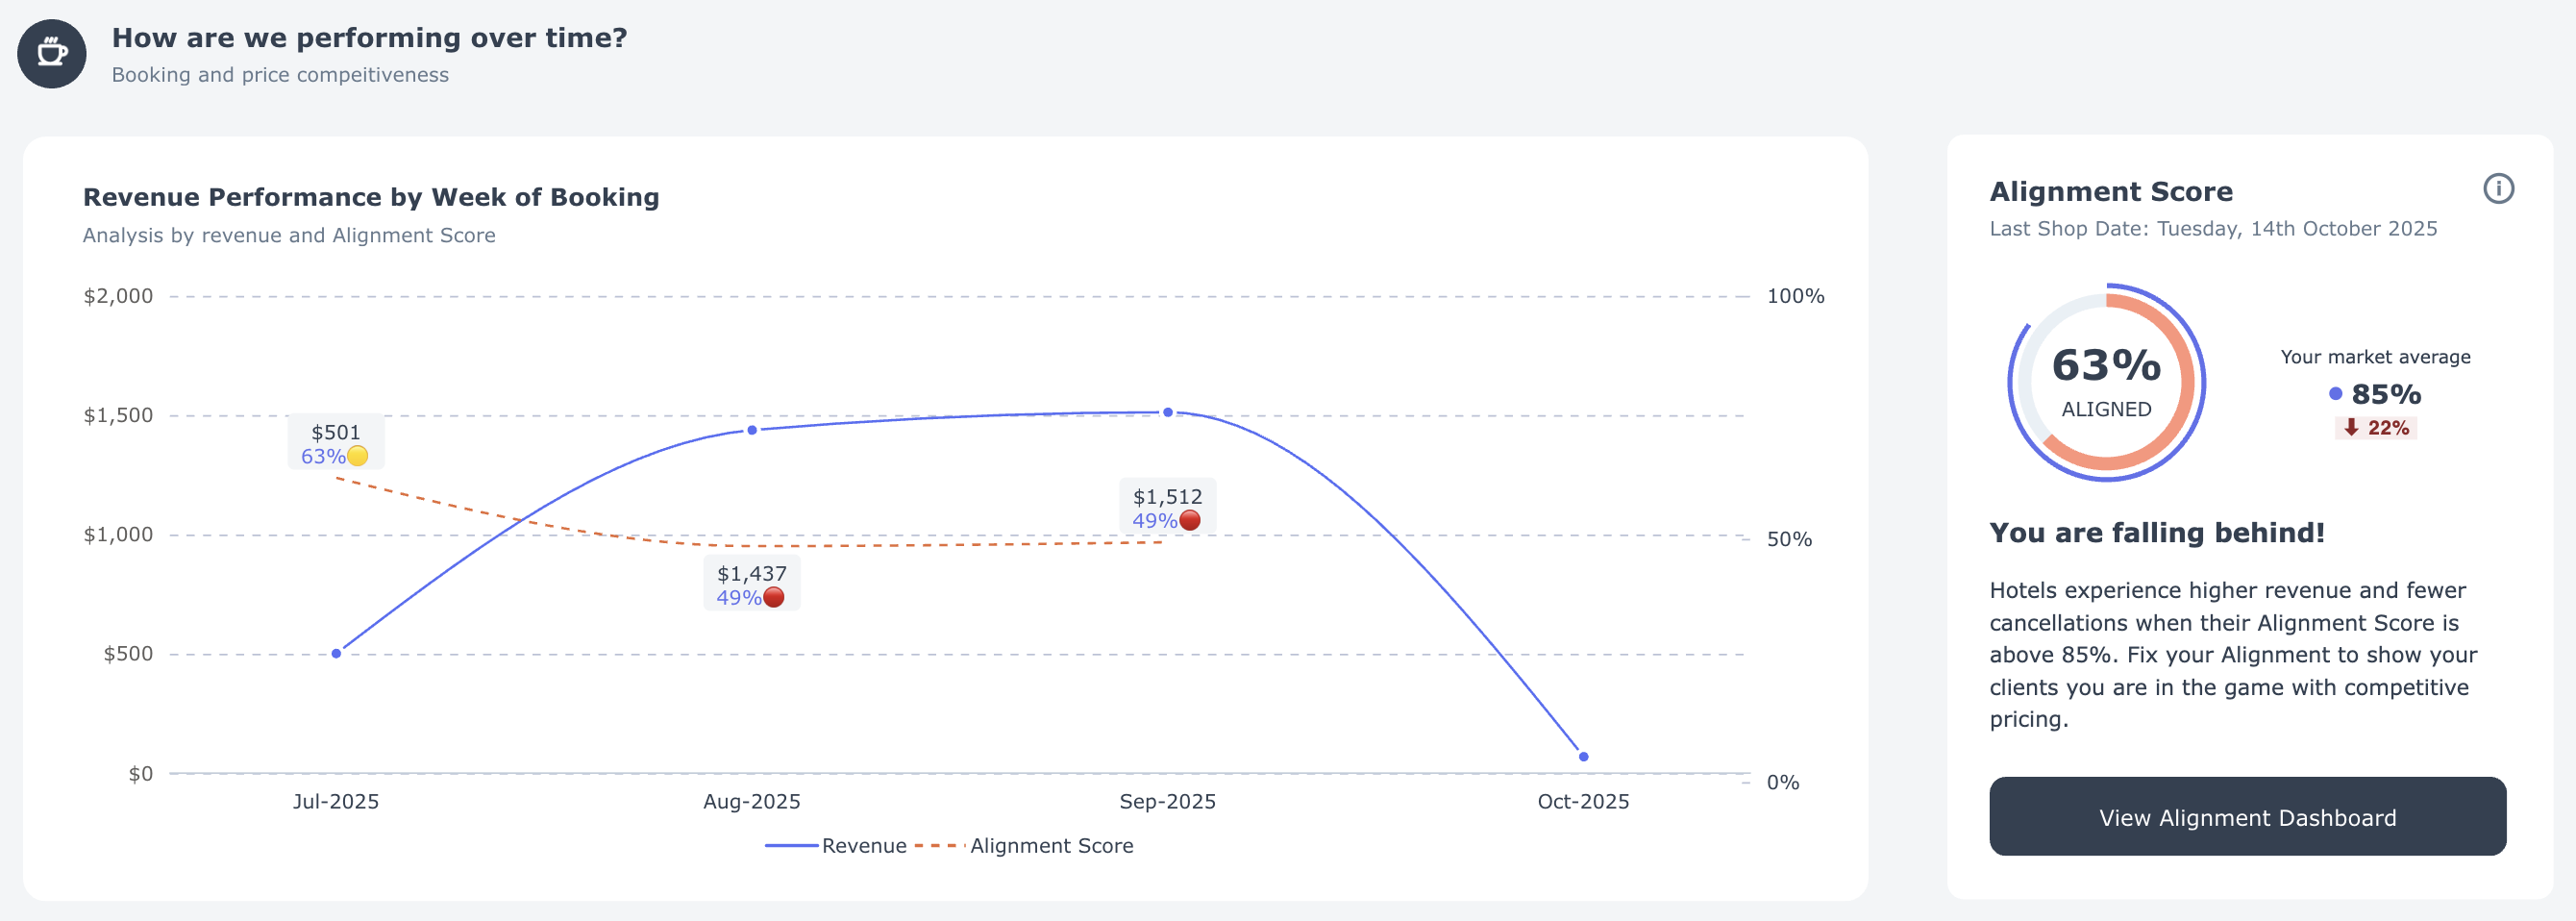

- What you see: Your weekly booking revenue (blue line) and your Alignment Score (orange dotted line) — a measurement of how competitive your prices are in the market.
- Why it matters: Properties with an Alignment Score above 85% generate more revenue and experience fewer cancellations.
- What to do: When your score drops, review your rates in the Alignment Dashboard to maintain competitiveness and protect revenue.
Booking Pace by Month of Check-In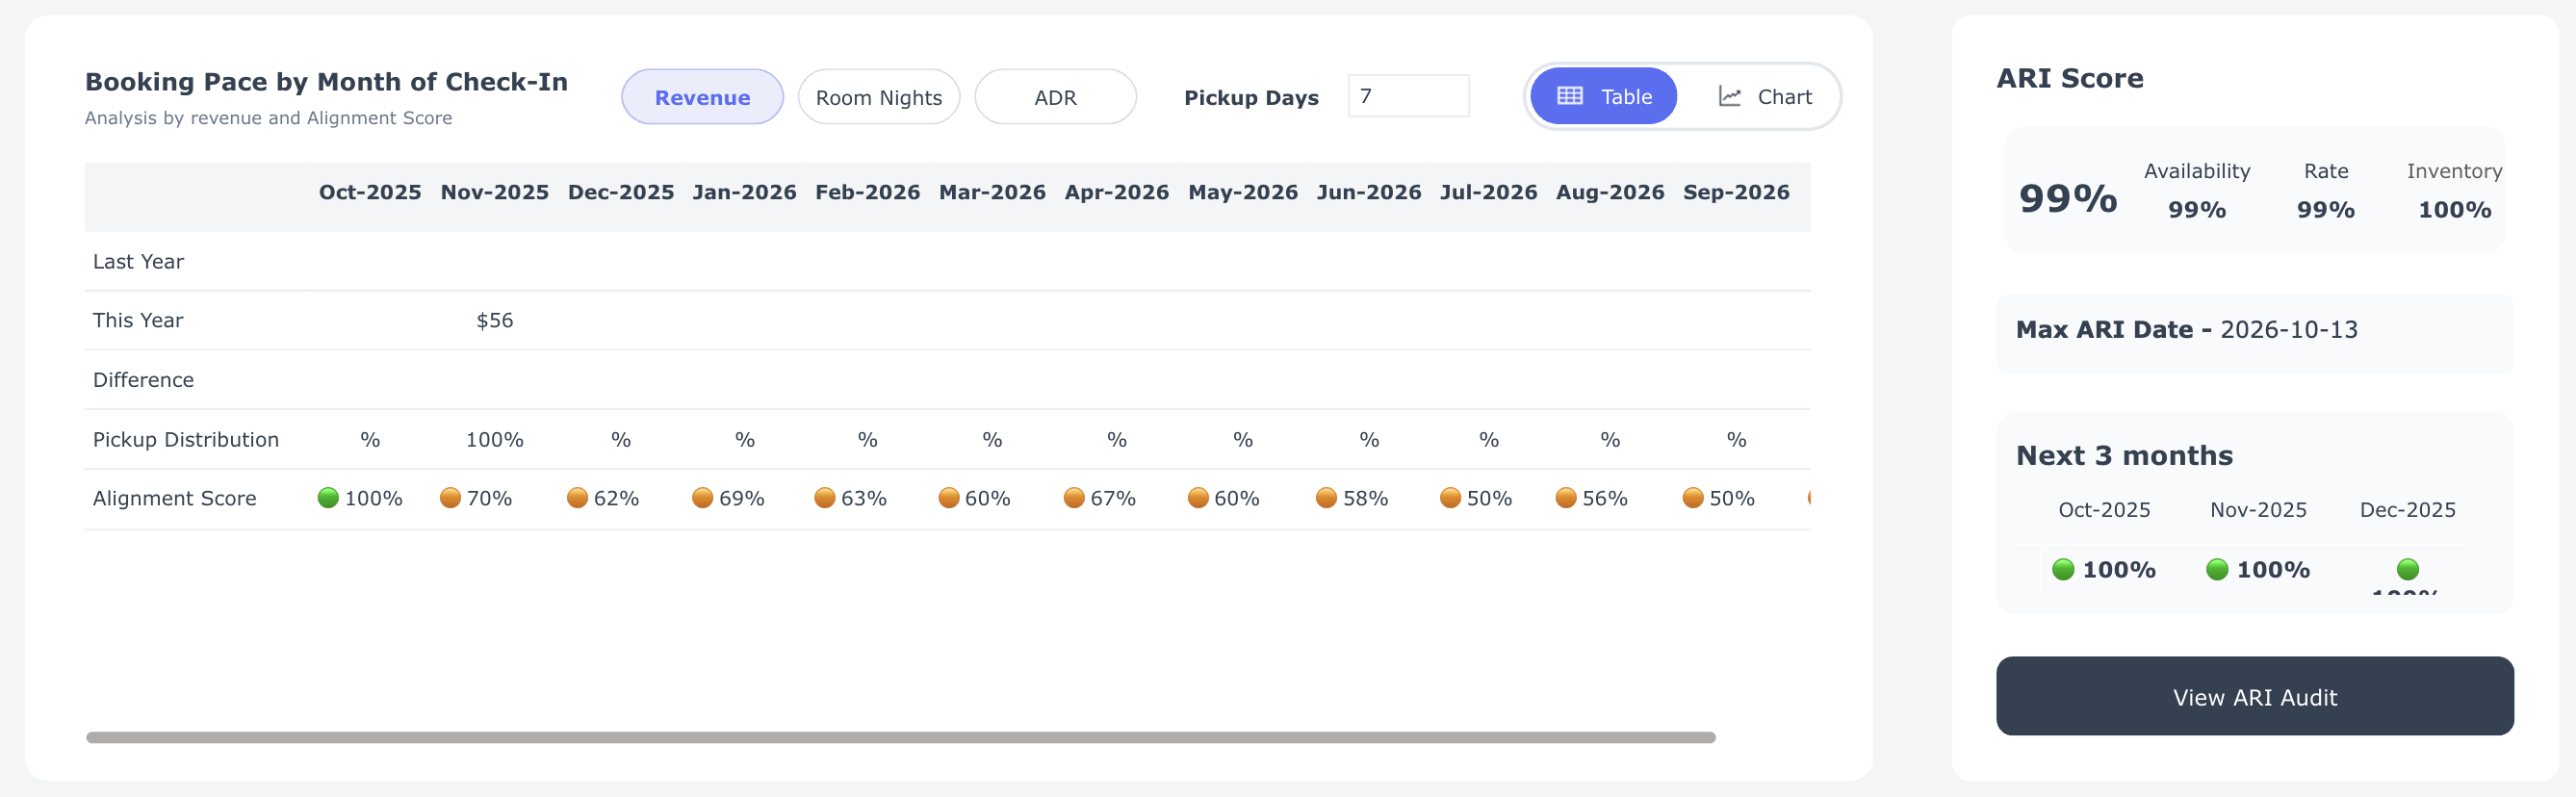

- What you see: Booking momentum for this year month by month compared to last year.
- Your controls:
- Metrics – Switch between:
- Revenue – Total booking revenue.
- Room Nights – Total nights booked.
- ADR (Average Daily Rate) – Average price per night.
- Pickup Days – Lead time before check-in.
- View Options – Toggle between Chart for trends and Table for detailed numbers.
- Metrics – Switch between:
- What to do: Use the chart to identify performance gaps early, compare with last year's results, and take appropriate action — adjust rates, create promotions, or focus marketing efforts to stimulate demand.
How to Interpret
- Revenue: If this year's line falls below last year's for upcoming months, you risk underperforming — consider implementing promotions or adjusting rates.
- Room Nights: When bookings lag behind last year, occupancy may decrease; examine your availability and demand drivers.
- ADR: A lower ADR than last year suggests excessive discounting; if ADR is higher but bookings are slow, your prices might be too high.
- Pickup Days: Shorter lead times indicate last-minute bookings; longer lead times suggest strong future demand or early discount strategies.
ARI Scorecard
A snapshot of your availability, rate, and inventory available on the Hotel Trader Exchange to sell.
We recommend keeping at least 365 days of inventory on shelf at all times.
Distribution Summary
Understand which clients, rate plans, and room types drive your revenue — and explore these trends more deeply with interactive filtering.

What you see:
This section shows your top 10 performers across three key dimensions:
- By Client Name – Which clients generate the most revenue.
- By Rate Code – Which rate plans produce the highest revenue.
- By Room Type – Which room categories are booked most frequently.
Interactive filtering (hidden power feature):
- Click on any Client Name, Rate Code, or Room Type to instantly update the other two charts.
- The refreshed charts will display the top 10 performers for your selection only.
- Example: Click on a client name to see that client's top 10 rate plans and room types.
- Click on a rate code to discover which clients and room types use that plan most.
- Click on a room type to identify which clients and rate codes book it most frequently.
Why it matters:
- Quickly identify which combinations of clients, rate plans, and room types generate the most revenue.
- Spot upsell opportunities (e.g., when a client consistently books lower-category rooms).
- Identify where to focus promotions or adjust pricing to maximize yield.
What to do:
- Use the interactive filtering to focus on specific clients, rate plans, or room types.
- Identify patterns and mismatches (e.g., a popular rate plan that's underutilized by a key client).
- Adjust your rate strategy or marketing campaigns to capture more revenue from your most profitable combinations.